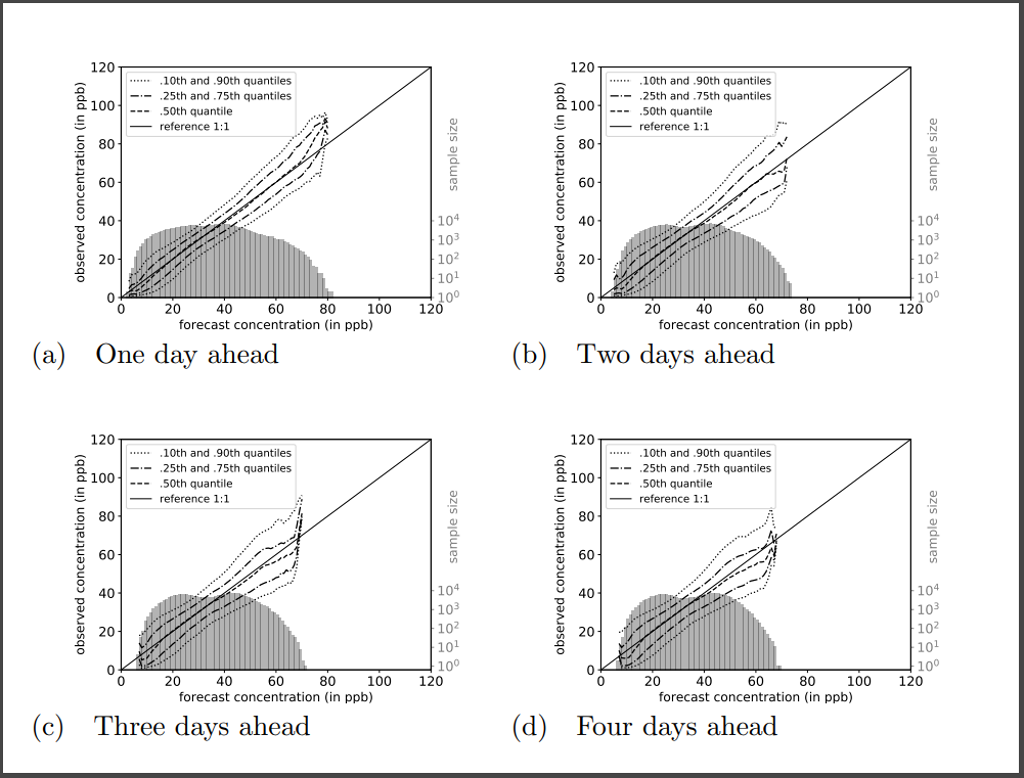
To evaluate the model performance, we base our analysis on the full joint distribution of forecasts and observations (Murphy and Winkler, 1987). We access detailed information on the joint distribution by factorisation into a conditional, and a marginal distribution [Figure 10].
Moreover, we evaluate our model against persistence and a climatological (observational) reference model. A new model only has a genuine added value against those simple reference models, if it outperforms both of them. To analyses this, we use skill scores which are relative relations of scoring rules like the mean squared error (MSE).